Car Price Prediction
Artificial Neural Network for Used Car Price Estimation
An end-to-end machine learning project that predicts used car selling prices from vehicle specifications, ownership information, and location-related features.
Predicting Used Car Prices from Real-World Features
Used car valuation is governed by complex, nonlinear interactions between mechanical wear, physical specifications, brand tier, and local market geography.
The Real-World Valuation Challenge
Manual or simple linear estimation of used-car prices frequently fails because vehicle depreciation is not monotonic. Factors like power-to-weight, engine displacement, ownership transfers, fuel type, and regional market density interact in non-linear ways.
- Messy, Unstructured String Attributes: Critical features such as torque and mileage were stored as heterogeneous strings with mixed units (e.g.,
113Nm@ 4200rpm,22,00 kmpl,48@ 3,000+/-500(NM@ rpm)). - High Cardinality Spatial Variables: Over 1,187 unique cities and 49 states introducing severe sparsity risks if naive one-hot encoding were applied.
- Skewed Outliers & Non-linear Curves: High-end luxury cars and extreme power spikes that distort unregularized regression models.
The End-to-End Machine Learning Solution
Rather than training a superficial model, this project implements a rigorous, leakage-free data science pipeline from raw data auditing and custom regex parsing to deep neural architecture tuning.
- Strict Data Leakage Prevention: Train/test splitting executed before target encoding, ensuring out-of-fold median mapping for unseen test categories.
- Custom Regex Feature Extraction: Deconstructed multi-format torque and mileage strings into physical engineering units (Nm and RPM).
- Deep ANN Stabilization: Overcame vanishing gradients in 3-layer Sigmoid architectures using Batch Normalization, Dropout, and dynamic learning rate scheduling.
4,200 Raw Records
16 heterogeneous features audited, cleaned, and engineered without synthetic data fabrication.
Leakage-Free Encoding
Target encoding calculated strictly on the training partition with fallback imputation for testing.
Sigmoid ANN Tuning
Retained 3-layer Sigmoid constraints while unlocking high accuracy via Batch Normalization.
0.8634 R² Score
Dramatically boosted predictive power from -0.4933 (baseline) to 86.34% explained variance.
Dataset Architecture & Feature Breakdown
Comprehensive inspection of the 4,200 records, examining missing values, categorical cardinalities, and numerical scales.
| COLUMN | RAW TYPE | CARDINALITY / RANGE | CATEGORY | PREPROCESSING / TRANSFORMATION | NOTES |
|---|---|---|---|---|---|
| selling_price | float64 | Continuous | Target | Dropped 1 missing row; target of regression | Primary prediction target. Right-skewed distribution ranging from 299.99 to 95,000+. |
| name | object → float64 | 32 brands → 15 + Other | Vehicle Attribute | Group low frequencies into "Other", Target Encoded on Train split | Maruti, Hyundai, Tata, Ford, Chevrolet top volume. Strong brand prestige pricing signal. |
| year | int64 → dropped | 1994 – 2020 | Vehicle Attribute | Transformed into age = 2025 - year; original year dropped | Older vehicles experience steep exponential & non-linear price depreciation. |
| age | int64 → float64 | 5 – 31 years | Vehicle Attribute | Engineered from 2025 - year, scaled with MinMaxScaler | Direct linear and non-linear correlation with vehicle mechanical wear and market depreciation. |
| mileage | object → float64 | Continuous (kmpl / km/kg) | Vehicle Attribute | Comma replaced with dot, cast to float, MinMaxScaler | Fuel efficiency rating. Stored as messy string in raw dataset (e.g., "22,00"). |
| engine | int64 → float64 | 624 – 3604 CC | Vehicle Attribute | MinMaxScaler normalized | Displacement volume. Strong positive correlation (+0.46) with vehicle market tier. |
| max_power | float64 | 32.8 – 400.0 BHP | Vehicle Attribute | MinMaxScaler normalized | Brake Horsepower. Strongest single numeric predictor of vehicle price (+0.75 correlation). |
| torque | object → 2 features | Messy text | Vehicle Attribute | Regex extracted into torque_clean (Nm) & torque_rpm_clean (RPM) | Highly heterogeneous strings with multiple RPM ranges and kgm/Nm unit mixtures. |
| torque_clean | float64 | 48.0 – 620.0 Nm | Vehicle Attribute | Parsed Nm value, kgm * 9.80665 converted, median imputed, MinMaxScaler | Peak rotational force. Direct physical metric of vehicle pulling power and premium capability. |
| torque_rpm_clean | float64 | 1000 – 5000 RPM | Vehicle Attribute | Extracted RPM or midpoint of range, median imputed, MinMaxScaler | Engine speed at peak torque. Differentiates low-end diesel grunt from high-revving petrol. |
| seats | int64 → float64 | 2, 4, 5, 7, 8, 9, 10 | Vehicle Attribute | MinMaxScaler normalized | Passenger capacity. Differentiates sports hatchbacks, family sedans, and large commercial vans. |
| Region | object → 3 dummy cols | 4 categories | Location | One-hot encoded (Central, East, South, West; drop_first=True) | Broad regional market dynamics across Central (1312), East (1020), West (1014), South (854). |
| State or Province | object → float64 | 49 states | Location | Target Encoded on Train split; test set mapped with median fallback | State-level economic variations, tax structures, and used-car market density. |
| City | object → float64 | 1,187 cities | Location | Cities < 10 records grouped to "Other", then Target Encoded on Train | Extreme cardinality. Grouping rare cities prevents severe variance and memory explosion. |
| fuel | object → 4 dummy cols | 5 categories | Commercial | One-hot encoded (Diesel, Petrol, CNG, LPG, Electric; drop_first=True) | Fuel type significantly influences running costs and resale demand. |
| seller_type | object → 2 dummy cols | 3 categories | Commercial | One-hot encoded (Individual, Dealer, Trustmark Dealer; drop_first=True) | Dealer warranties and certified inspections command measurable market premiums over peer-to-peer. |
| transmission | object → 1 dummy col | 2 categories | Vehicle Attribute | One-hot encoded (Manual vs Automatic; drop_first=True) | Automatic transmissions systematically price higher than manual counterparts. |
| owner | object → 4 dummy cols | 5 categories | Commercial | One-hot encoded (First, Second, Third, Fourth & Above, Test Drive; drop_first=True) | Vehicle history and multi-hand depreciation directly discount used valuation. |
| Sales_ID | int64 → dropped | Unique ID | Identifier | Dropped prior to model training | Database transaction primary key with zero causal relationship to vehicle valuation. |
Exploratory Data Analysis & Statistical Audits
Evaluating target skewness, feature inter-correlations, and quantitative IQR outlier boundaries before initiating modeling.
Selling Price Distribution (Right-Skewed)
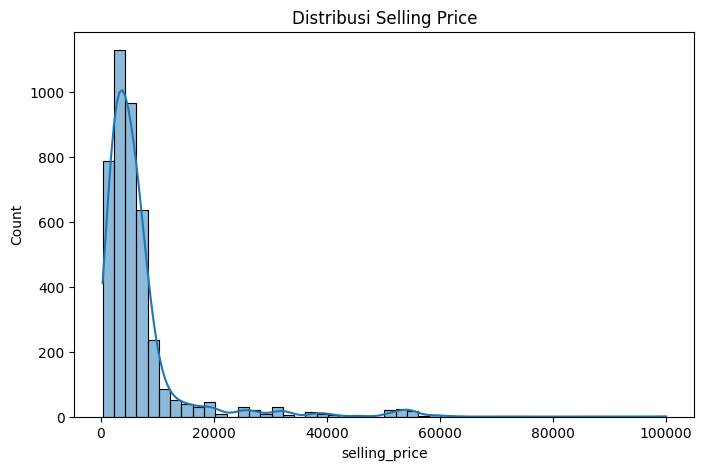
Finding: The distribution of selling_price exhibits strong positive skewness. The majority of vehicles trade between 2,000 and 8,000 units, while luxury and executive tiers extend past 50,000 to 95,000.
Multivariate Correlation Heatmap
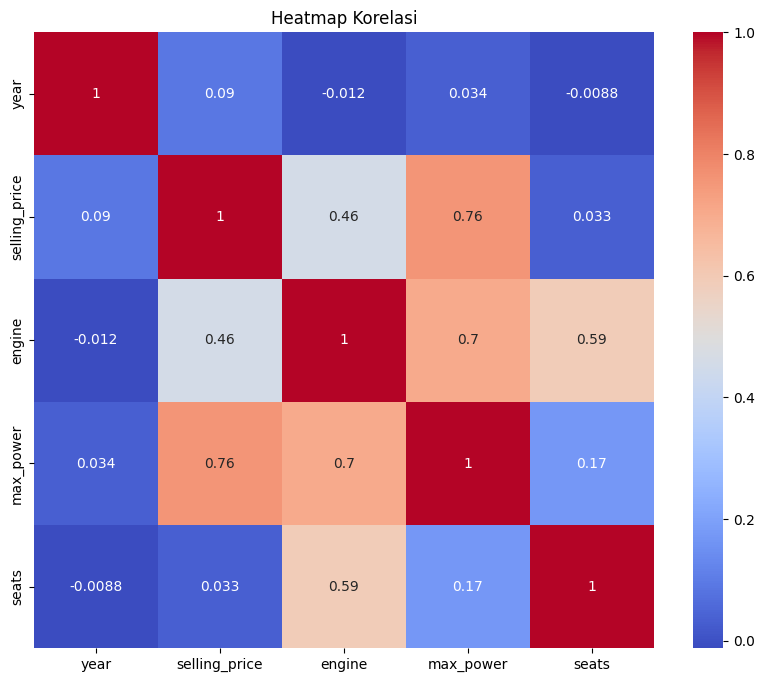
Key Correlations: max_power is the strongest linear predictor (+0.75), followed by torque_clean (+0.54) and engine (+0.46). Vehicle age exerts a steady depreciation drag.
IQR Outlier Analysis & Handling Strategy
Calculated using standard Interquartile Range thresholds: Q1 - 1.5×IQR to Q3 + 1.5×IQR. Outliers reflect legitimate domain variance rather than measurement errors.
Feature Outlier: max_power
Q1: 67.0 | Q3: 102.0 | IQR: 35.0 | Upper: 154.5 BHP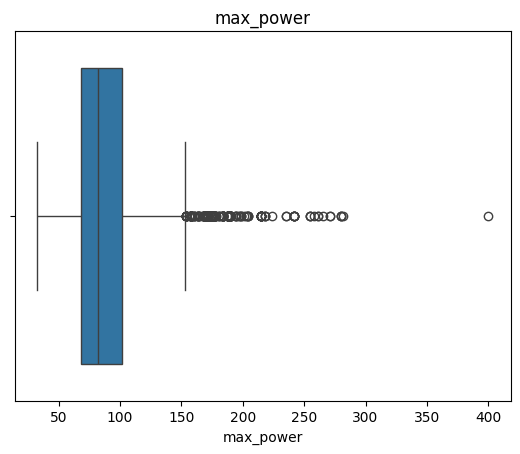
High-end performance and luxury vehicles generate extreme power spikes that require bounded scaling.
Preserved in dataset; normalized via MinMaxScaler to maintain continuous luxury price separation.
Data Cleaning & Unit Standardization
Transforming messy, mixed-format string values into robust, model-ready numerical and categorical structures.
Missing Target Dropping
selling_price: 1 NaN valuedf.dropna(subset=['selling_price'])Regression targets cannot be synthetically imputed without distorting ground truth. The single missing row was safely removed (4,200 → 4,199).
Mileage Comma Parsing
"22,00", "19,09" (object).str.replace(',', '.').astype(float)European decimal comma notation was converted to standard float points to restore continuous numerical calculation.
Complex Torque Regex Decomposition
"113Nm@ 4200rpm", "48@ 3000(kgm)"torque_clean (Nm) + torque_rpm_cleanCustom regex parser normalized kgm → Nm (* 9.80665), computed range midpoints for RPMs, and imputed missing values with median.
Vehicle Age Linearization
year = 2018, 2012, 1994...age = 2025 - year; drop(year)Age provides direct linear alignment with mechanical wear, distance traveled, and market depreciation curves.
Feature Engineering & Leakage-Free Preprocessing
Building a watertight preprocessing pipeline that prevents data leakage through strict train/test split isolation and cardinality-based encoding.
Target Mean Encoding (Leakage-Free)
Applied to variables with vast category spaces to compress dimensionality without sparse matrix explosions:
- Vehicle Brand (
name): Top 15 brands preserved (Maruti, Hyundai, Tata, etc.); rare brands grouped into'Other'prior to encoding. - State or Province (49 states): Encoded against training target mean.
- City (1,187 cities): Cities with frequency < 10 grouped into
'Other', then target encoded.
mapping = train_df.groupby(col)[target].mean()test_encoded = test_df[col].map(mapping).fillna(train_encoded.median())One-Hot Dummy Encoding (drop_first=True)
Applied to discrete nominal features to represent categories orthogonally without collinearity:
- Region (4): Central, East, West, South.
- Fuel Type (5): Petrol, Diesel, CNG, LPG, Electric.
- Seller Type (3): Individual, Dealer, Trustmark Dealer.
- Transmission (2): Manual vs Automatic.
- Owner History (5): First, Second, Third, Fourth & Above, Test Drive Car.
all_numeric = ['mileage','engine','max_power','seats','torque_clean','torque_rpm_clean','age','name','State','City']scaler.fit_transform(X_train) / scaler.transform(X_test)Artificial Neural Network (ANN) Architecture
Designing a deep, regularized regression neural network with 3 hidden layers and Sigmoid activations.
Non-Linear Multi-Factor Dynamics
Vehicle pricing exhibits complex threshold behavior (e.g., luxury brands retain value differently over age compared to budget fleet models). Neural network hidden layers capture these multi-way interactions.
Mixed Continuous & Encoded Inputs
The architecture maps both continuous physical measures (power, engine, torque) and discrete categorical embeddings onto a unified latent pricing manifold.
Continuous Price Regression
The linear output node outputs an unbounded continuous price estimate, allowing calibrated predictions across both entry-level commuter cars and high-end luxury models.
Training Convergence & Vanishing Gradient Resolution
Analyzing how Batch Normalization and adaptive learning rates prevented saturation and enabled steady multi-epoch convergence.
Unregularized Sigmoid (Loss Stagnation)
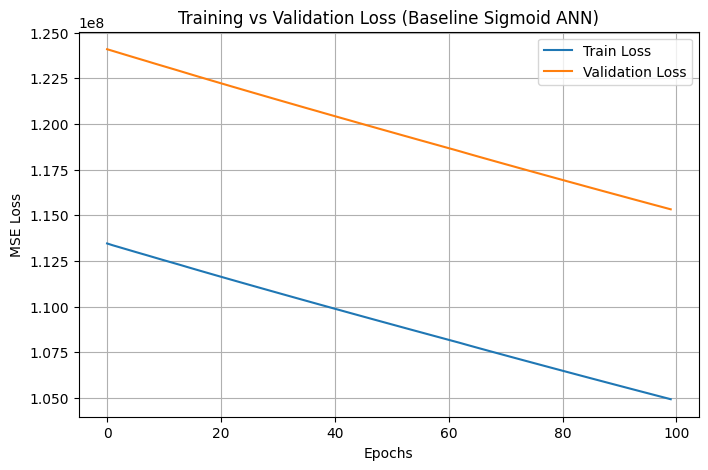
Without normalization, stacked Sigmoid activations compressed signals into saturated tails (gradients approaching 0). The model barely learned, producing an invalid negative R² (-0.4933).
Sigmoid + BatchNorm + Dropout + Adaptive LR
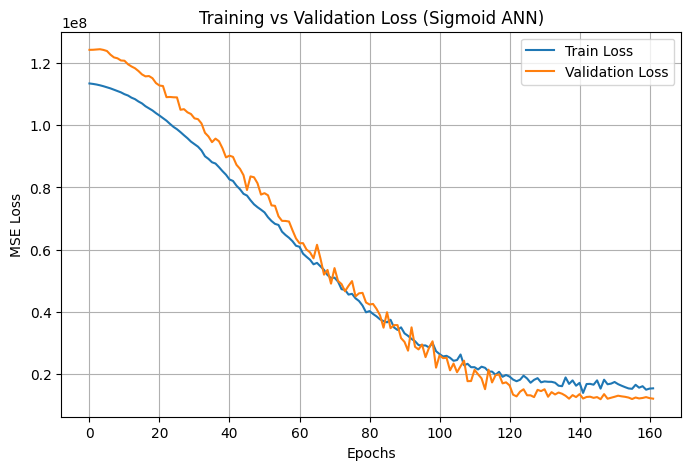
Batch Normalization recentered intermediate layer activations around zero mean, allowing Sigmoid derivatives to remain active. Train and validation losses tracked closely without overfitting.
Quantitative Evaluation & Benchmark Comparison
Rigorous side-by-side performance evaluation on the unseen 840-sample test set.
Test Set Regression Metrics (840 Test Samples)
Exact measurements from 2B.ipynb test execution| MODEL ARCHITECTURE | MAE (Mean Absolute Error) | RMSE (Root Mean Squared Error) | R² SCORE (Explained Variance) | VERDICT |
|---|---|---|---|---|
| Baseline ANNDense(512-256-128, Sigmoid), lr=0.001, No Norm | 6,009.4054 | 10,452.0669 | -0.4933 | Severely Underfit |
| Optimized Tuned ANNSigmoid + BatchNorm + Dropout(0.2-0.1) + ReduceLR | 1,822.5018 | 3,161.5642 | 0.8634 (86.34%) | Optimal & Generalizable |
Absolute error plunged from 6,009 down to 1,822, vastly tightening prediction precision.
Root Mean Squared Error fell by over 7,290 units, drastically minimizing severe outlier errors.
Transitioned from negative baseline variance into robust 86.34% total market explanation.
Predicted vs Actual Price Alignment
Visualizing scatter plots against the 45-degree diagonal reference line (y = x) on the holdout test partition.
Baseline Prediction vs Actual
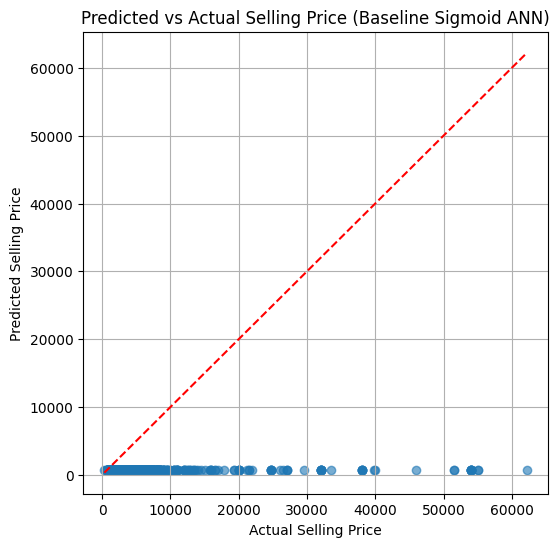
Observation: Points form a diffuse cloud that does not adhere to the red diagonal reference line. Predictions stay pinned near the mean, unable to capture high-value vehicles.
Tuned Prediction vs Actual (High Linear Fidelity)
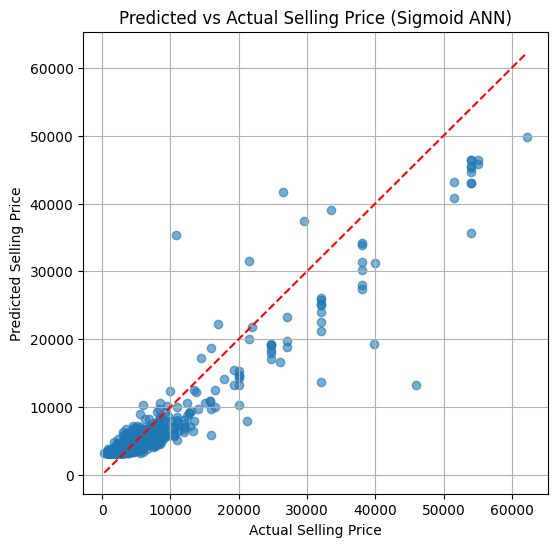
Observation: Data points cluster tightly along the diagonal reference line across commuter, mid-range, and luxury price brackets, demonstrating excellent model calibration.
Domain Valuation Dynamics Learned by the Network
Key physical, commercial, and geographical relationships represented within the engineered feature space.
Vehicle Age & Depreciation
Linearized age captures non-linear depreciation where initial steep value drops gradually plateau as vehicles reach functional utility baselines.
Engine Displacement & Power (BHP)
max_power (+0.75 correlation) and engine (+0.46) serve as primary anchors differentiating luxury and sports segments from economy platforms.
Torque & RPM Dynamics
Physical torque output (Nm) at specified RPM separates high-towing diesel utility vehicles from higher-revving urban runabouts.
Brand Tier & Market Perception
Target encoding of top automotive brands (Maruti, Hyundai, Tata, Ford, Chevrolet) embeds brand equity and aftermarket demand into the neural manifold.
Geographical Pricing Discrepancies
State and regional target encodings capture local economic conditions, regional taxes, and used car demand differentials across urban hubs.
Ownership Multi-Hand Discount
One-hot ownership features reflect standard market depreciation penalties for 2nd, 3rd, and 4th+ owner vehicles compared to certified dealer units.
End-to-End Pipeline Architecture
A unified overview of the machine learning pipeline from raw CSV ingestion to calibrated price output.
Audited 4,200 records across 16 columns; dropped 1 missing target row; confirmed 0 duplicates.
Analyzed right-skewed target distribution, computed correlation matrix, quantified IQR outliers.
Converted comma mileage to float; parsed multi-format torque strings into clean Nm and RPM.
Engineered vehicle age (2025 - year); partitioned dataset into 3,359 train and 840 test records.
Target encoded high-cardinality brand/state/city strictly on train data; one-hot encoded low-cardinality.
Scaled all 10 continuous and target-encoded features onto [0, 1] range to avoid gradient explosions.
Trained 512 → 256 → 128 Sigmoid network with BatchNorm, Dropout, EarlyStopping, and ReduceLROnPlateau.
Evaluated on test set, validating 86.34% R² and 1,822.50 MAE with tightly clustered diagonal scatter.
Technology & Tooling Stack
Libraries and frameworks utilized across data manipulation, neural modeling, and evaluation.
Python
Core programming language for end-to-end data manipulation and modeling.
TensorFlow & Keras
Sequential ANN modeling, custom layer stacking, callbacks, and gradient descent.
Scikit-Learn
Train-test splitting, MinMaxScaler, and regression evaluation metrics (MAE, RMSE, R²).
Pandas & NumPy
DataFrame restructuring, string parsing, regex transformations, and array computations.
Matplotlib & Seaborn
Statistical distribution plotting, correlation heatmaps, boxplots, and loss curves.
Jupyter Notebook
Interactive experimentation, iterative model training, and cell validation.
My Role & Contributions
Specific machine learning and data science tasks performed throughout the project lifecycle.
Exploratory Data Analysis
Audited data distributions, identified 1 missing target value, computed correlation matrices, and detected numerical outliers using the IQR rule.
Data Cleaning & Parsing
Constructed robust regex parsers for complex torque and mileage strings, standardized unit systems, and removed irrelevant identifier columns.
Feature Engineering
Derived vehicle age from production year, decomposed torque into Nm and RPM components, and grouped low-frequency categories to reduce sparsity.
Leakage-Free Encoding
Isolated target encoding calculations strictly to the training split, preventing data leakage into the test set.
ANN Architecture & Tuning
Integrated Batch Normalization, Dropout, and learning rate schedules into a 3-layer Sigmoid ANN, overcoming severe vanishing gradient issues.
Comprehensive Evaluation
Evaluated models across MAE, RMSE, and R² scores, validated learning curves, and confirmed prediction calibration via scatter plots.
Technical Challenges & Engineering Solutions
Overcoming real-world data science roadblocks through disciplined experimentation.
Vanishing Gradients in Deep Sigmoid Layers
Problem: The baseline model with 3 stacked Sigmoid layers failed to learn, resulting in flat loss stagnation and a negative R² score (-0.4933).
Heterogeneous Torque String Formatting
Problem: Torque values mixed kgm and Nm units, single RPM points, and RPM ranges (e.g., 1750-3000rpm).
Extreme High-Cardinality Location Sparsity
Problem: 1,187 unique cities and 49 states would cause extreme dimension explosion if one-hot encoded.
'Other' and applied target mean encoding calculated strictly on training data.Outlier Sensitivity & High Luxury Skew
Problem: Luxury vehicle prices extended past 95,000, creating heavy skew that could dominate MSE loss.
Project Limitations & Future Directions
Critical self-evaluation of dataset boundaries and roadmap for production maturation.
Dataset Limitations
- Sample Size Boundary: 4,200 records represent a regional slice; larger continental datasets are needed for broader generalization.
- Missing Maintenance & Accident History: The dataset lacks granular service records, crash damage, and tire wear, which strongly influence used car market value.
- Static Market Timing: Predictions reflect a single time snapshot and do not account for inflation, macro interest rates, or seasonal automotive demand spikes.
Future Engineering Roadmap
Compare ANN performance against XGBoost, LightGBM, and CatBoost ensembles.
Apply SHAPley values to quantify exact feature attributions for individual vehicle predictions.
Implement 5-fold stratified CV to verify consistency across different sample distributions.
Containerize preprocessing pipeline and weights into a FastAPI endpoint with ONNX runtime.
Project Outcomes & Key Takeaways
A concise synthesis of what was accomplished and validated across this regression pipeline.
Explore the Code & Experiments
Inspect the complete Jupyter notebook (2B.ipynb), preprocessing functions, neural network architectures, and training logs on GitHub.